
Verification & Transparency
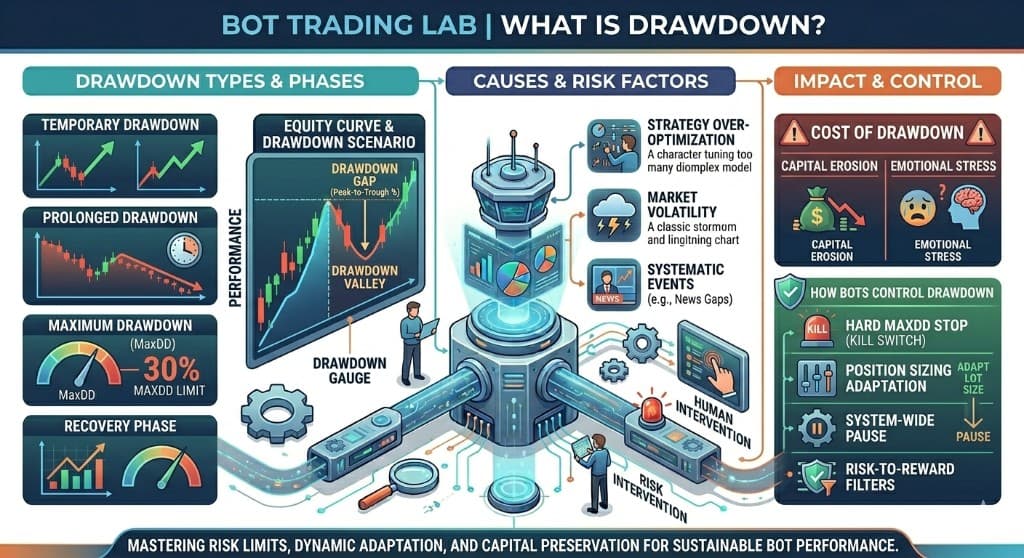
What Is Drawdown in Trading?
The Most Important Risk Metric Every Trader Should Understand
When traders evaluate a trading strategy, they often focus on profits.
Questions like:
- How much did the strategy make?
- What was the monthly return?
- What is the win rate?
are common.
However, professional traders usually ask a different question first:
“What was the drawdown?”
Drawdown is one of the most important measures of risk in trading. It helps traders understand how much an account declined during losing periods and provides valuable insight into the behaviour of a trading strategy.
In this guide, we’ll explain what drawdown is, how it is calculated, and why experienced traders often consider it more important than profit alone.
What Is Drawdown?
Drawdown is the decline in an account’s value from a previous peak to a subsequent low point.
In simple terms:
It measures how much money was lost before the account recovered and reached a new high.
Example
Imagine a trading account starts at $10,000.
The account grows to $12,000.
The account then falls to $10,800.
The decline from $12,000 to $10,800 equals $1,200.
This represents a drawdown of 10%.
The drawdown ends when the account reaches a new equity high above $12,000.
Why Drawdown Matters
Most traders can tolerate losing trades.
What many struggle with is experiencing a prolonged decline in account value.
Drawdown helps answer important questions such as:
- How much risk does this strategy take?
- How difficult are losing periods?
- Can I tolerate the strategy psychologically?
- Is the return worth the risk?
Without understanding drawdown, profitability alone provides an incomplete picture — and it is central to deciding whether a trading bot is really profitable.
Types of Drawdown
There are several ways drawdown is measured.
Absolute Drawdown
Measures the decline below the original account balance.
Relative Drawdown
Expressed as a percentage decline from the highest equity point.
This is the most commonly used drawdown measurement.
Maximum Drawdown
The largest decline experienced during the entire trading period.
Maximum drawdown is often considered the most important risk metric.
Example of Maximum Drawdown
Imagine the following account progression:
| Step | Account Value |
|---|---|
| 1 | $10,000 |
| 2 | $12,000 |
| 3 | $11,500 |
| 4 | $13,000 |
| 5 | $10,400 |
| 6 | $14,000 |
The largest decline occurred from $13,000 to $10,400.
This represents a drawdown of 20%.
The maximum drawdown for this period is therefore 20%.
Drawdown vs Losing Trades
Many new traders confuse drawdown with losing trades.
They are not the same.
A strategy may:
- Have many losing trades
- Maintain a relatively small drawdown
Or:
- Have a high win rate
- Experience a very large drawdown
Drawdown measures the overall decline in account value, not the number of losing trades.
Why Professional Traders Focus on Drawdown
Professional traders understand that protecting capital is often more important than maximizing returns.
Two strategies might generate identical returns:
Strategy A
Annual return: 20%
Maximum drawdown: 8%
Strategy B
Annual return: 20%
Maximum drawdown: 35%
Most professional investors would prefer Strategy A because it achieves the same return with significantly less risk.
The Psychological Impact of Drawdown
Drawdown is not just a mathematical concept.
It is also a psychological challenge.
Imagine your account declines:
- 5%
- 10%
- 15%
- 20%
Many traders begin questioning the strategy long before recovery occurs.
Common reactions include:
- Turning the system off
- Reducing position sizes
- Abandoning the strategy entirely
Ironically, some traders stop using a system just before performance improves.
Understanding expected drawdown helps traders remain disciplined during difficult periods.
Open Drawdown vs Closed Drawdown
This distinction is particularly important in automated trading.
Closed Drawdown
Measures losses that have already been realized.
Open Drawdown
Measures unrealized losses on currently open positions.
A strategy may have:
- Small closed drawdowns
- Larger temporary open drawdowns
Both metrics should be considered when evaluating risk.
Is a Lower Drawdown Always Better?
Not necessarily.
Many traders assume lower drawdown automatically means a superior strategy.
In reality, there is often a relationship between:
- Risk
- Return
- Drawdown
A strategy producing higher returns may naturally experience larger drawdowns.
The key question becomes:
Is the drawdown reasonable relative to the return generated?
This is known as risk-adjusted performance.
What Is a Good Drawdown?
There is no universal answer.
Acceptable drawdown depends on:
- Risk tolerance
- Investment goals
- Strategy type
- Time horizon
As a general guideline:
Conservative Strategies
Often target 5%–10% maximum drawdown.
Moderate Strategies
Often experience 10%–20% maximum drawdown.
Aggressive Strategies
May experience 20%–40% or more.
The important factor is whether the drawdown aligns with the trader’s expectations and objectives.
Why Drawdown Happens
Every trading strategy experiences periods of underperformance.
Common causes include:
Changing Market Conditions
Strategies may perform differently during:
- Trending markets
- Ranging markets
- High volatility periods
- Low volatility periods
Statistical Variance
Even profitable systems experience losing streaks.
Unexpected Events
Economic surprises, geopolitical events, and market shocks can all influence drawdown levels.
How Traders Can Manage Drawdown
Drawdown cannot be eliminated, but it can be controlled.
Common risk management techniques include:
Position Sizing
Limiting exposure on individual trades.
Diversification
Using multiple strategies or markets.
Maximum Exposure Limits
Preventing excessive concentration of risk.
Volatility Controls
Reducing exposure during unusual market conditions.
The goal is not to avoid drawdown entirely but to keep it within acceptable limits.
Common Misconceptions About Drawdown
Myth 1: Profitable Systems Should Never Experience Drawdowns
Every trading strategy experiences losing periods.
Myth 2: High Win Rates Mean Low Drawdowns
A high win rate does not guarantee low risk.
Myth 3: Drawdown Is Less Important Than Returns
Returns without understanding risk can be misleading.
Myth 4: Drawdown Can Be Eliminated
Risk can be managed, but not removed entirely.
How Investors Evaluate Drawdown
When reviewing a strategy, professional investors often compare:
- Total return
- Maximum drawdown
- Recovery time
- Consistency
They want to understand not only how much profit was generated but also how difficult the journey was. This is easiest when results are public — learn how to verify trading results and how to read a Myfxbook report.
A strategy that generates steady growth with controlled drawdowns is often viewed more favourably than one that produces dramatic gains accompanied by severe declines.
Final Thoughts
Drawdown is one of the most important risk metrics in trading.
It measures how much an account declines from a previous peak before recovering and reaching a new high.
While profits attract attention, drawdown reveals the true risk profile of a strategy.
Understanding drawdown helps traders:
- Evaluate risk realistically
- Set appropriate expectations
- Compare strategies effectively
- Maintain discipline during difficult periods
Successful trading is not just about making money.
It is also about managing risk in a way that allows long-term survival and consistent growth.
Frequently Asked Questions
What is drawdown?
Drawdown is the decline in account value from a previous peak to a subsequent low. It measures how much an account has fallen before recovering, and is one of the most important risk metrics in trading.
How is drawdown measured?
Drawdown is usually expressed as a percentage drop from the highest equity point to the lowest point before a new high is reached. Maximum drawdown is the largest such decline over a period.
What is a good maximum drawdown?
It depends on the trader's risk tolerance, but lower is generally better. Many professional investors favour strategies with controlled drawdowns (for example, under 10–15%) over those with high returns and large drawdowns.
Why does drawdown matter more than win rate?
A high win rate can hide large losses. Drawdown reveals how much risk was taken to achieve returns, making it a better measure of how sustainable and survivable a strategy really is.
How much return is needed to recover from a drawdown?
Recovery requires more than the loss itself. A 10% loss needs about an 11% gain to recover, a 50% loss needs a 100% gain, and an 80% loss needs a 400% gain — which is why limiting drawdown is so important.
Essential reading
Educational
Recommended

Important Disclaimer
This site is an independent research and review platform for educational purposes only.
Nothing on this website is financial advice. Trading involves risk, and performance varies by market conditions, strategy, and user decisions.